The question most multi-site operators can't (quickly) answer:
If you're running three, five, or eight locations, this question will probably take you a moment to answer. You might have a rough feel for it and be able to extract some data after an hour or two of investigating on the Partner Hub. But how about a clear, ranked list, by site, by shift, updated every seven days for each delivery marketplace? Most delivery restaurant operators don't have access to that.
It's a visibility problem, and there are some real costs attached to it.
Why single-site thinking does not scale
When you're running only one kitchen, you have a good sense of what's happening Monday to Sunday. You get the instinctive feeling of a bad week with refund claims clearly visible. You can then look at the rota, talk to the team, work out whether the issue is packing, staffing, or a particular rider.
At three sites, monitoring refunds on instinct may start to break down. At five, this ability is pretty much gone entirely. The operational data is still there, sitting inside Uber Eats Manager, Deliveroo Partner Hub, and Just Eat Partner Centre. But pulling data together, across delivery apps and locations, in a form that's useful for management decisions requires time and resources. And most teams barely have time to deal with issues in the kitchen.
The result: refund losses get absorbed without scrutiny, as there's no easy way to see them clearly enough to act before they become bigger problems. In a month or two, you realise one site has had tens of refund requests from customers due to packing issues. Something you could have resolved earlier if only you had full visibility across all of your sites.
What "visibility" means in practice
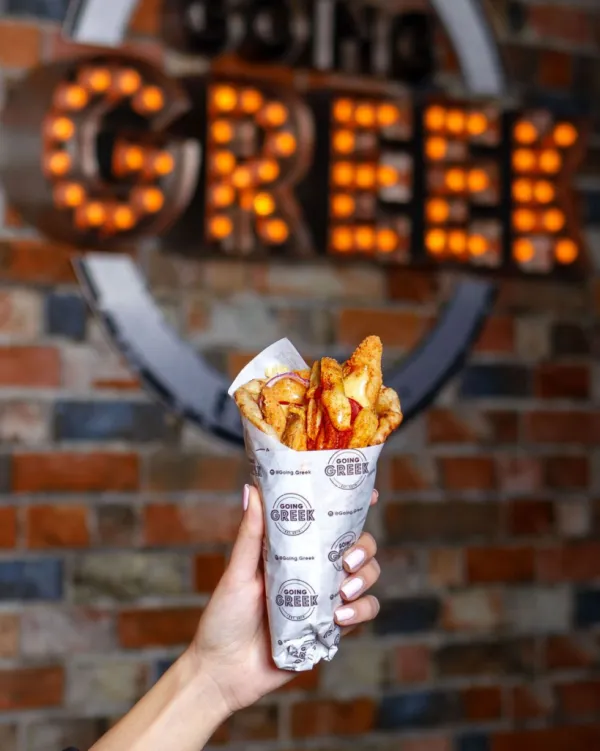
Going Greek is a five-site Greek street food group across North London with delivery acting as a core revenue channel across Uber Eats, Deliveroo, and Just Eat.
Before working with DeliveryByte, refund disputes were happening, or more often, not happening on a site by site basis. There was no consolidated picture of where exactly the refund dispute losses were concentrated. The team had no clear visibility of which site, which shift or which day of the week had the highest proportion of customer refund requests. It was not possible to track or notice particular trends or early signs of operational issues in each kitchen.
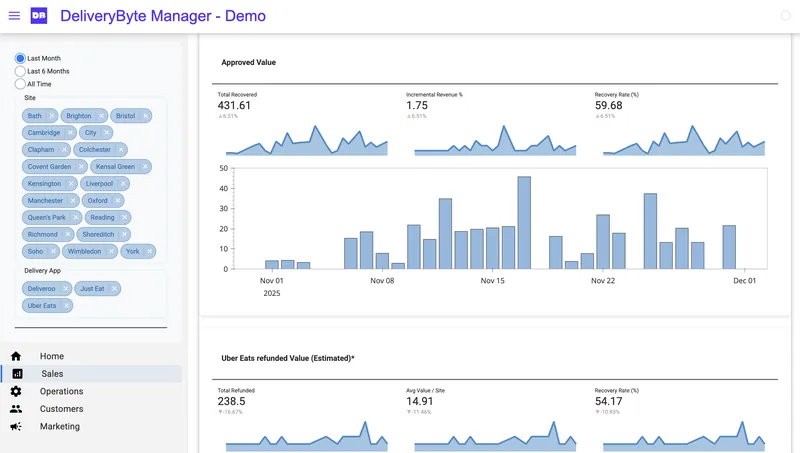
Now, the Going Greek team receives a weekly analytics report showing refund activity ranked across all five branches. The report shows which sites are generating the most dispute activity, which shifts are problem periods, and which locations are improving or deteriorating week on week.
"Someone else taking the legwork out of disputes, and giving us more weight to fight each case individually. That's a big part of the value." —Charlie Menegatos
What can you do with that information
The weekly DeliveryByte report is an effective management tool. For Going Greek, it changed how the team approaches operational problem solving and accountability:
Underperforming sites and shifts get identified quickly. Staffing decisions on problematic shifts can be reviewed against refund data. Week-on-week trends show whether solutions are working.
None of that is possible when refund data lives inside three different delivery app portals and nobody has the time to take a look and consolidate it in one place on a regular basis.
The compounding cost of not knowing
For a restaurant group generating £300-600k per year in delivery revenue, even a modest refund rate of 3-4% represents £9k-£24k losses annually. Not all of those refunds are unjustified as sometimes mistakes or delays happen and customers request fair compensation. Without sufficient visibility across sites, it's impossible to know where, at what time and how often refund dispute issues appear and whether anything can be done about it.
See the full picture
Going Greek recovered over 60% of disputed delivery refunds and gained full visibility across all locations using DeliveryByte. Read the full case study →